Lark Router supports live view monitoring of the messages flowing between the different binds. It’s separated by Suppliers and Clients.
Each view graphs different data:
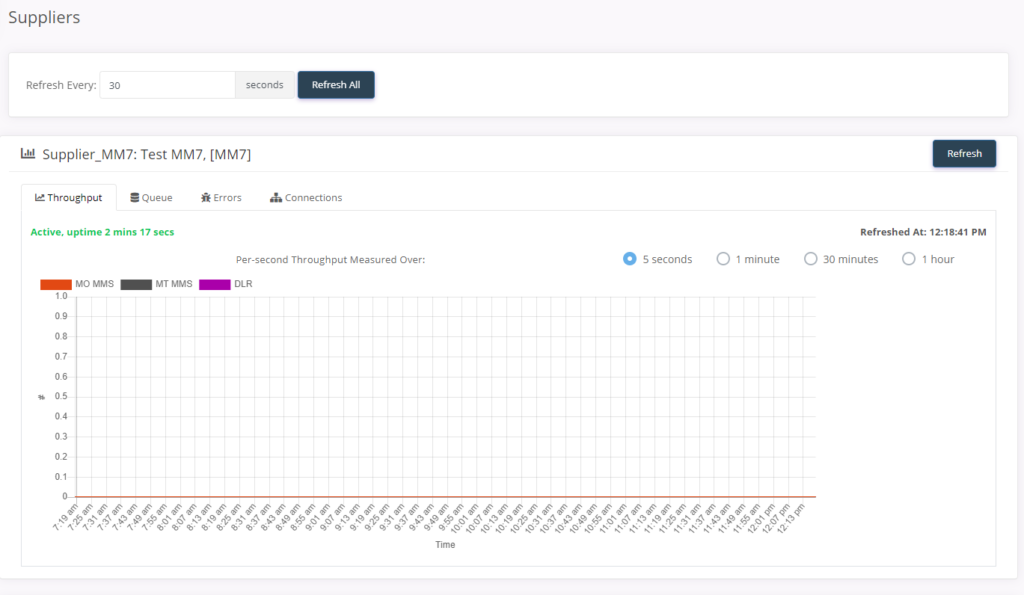
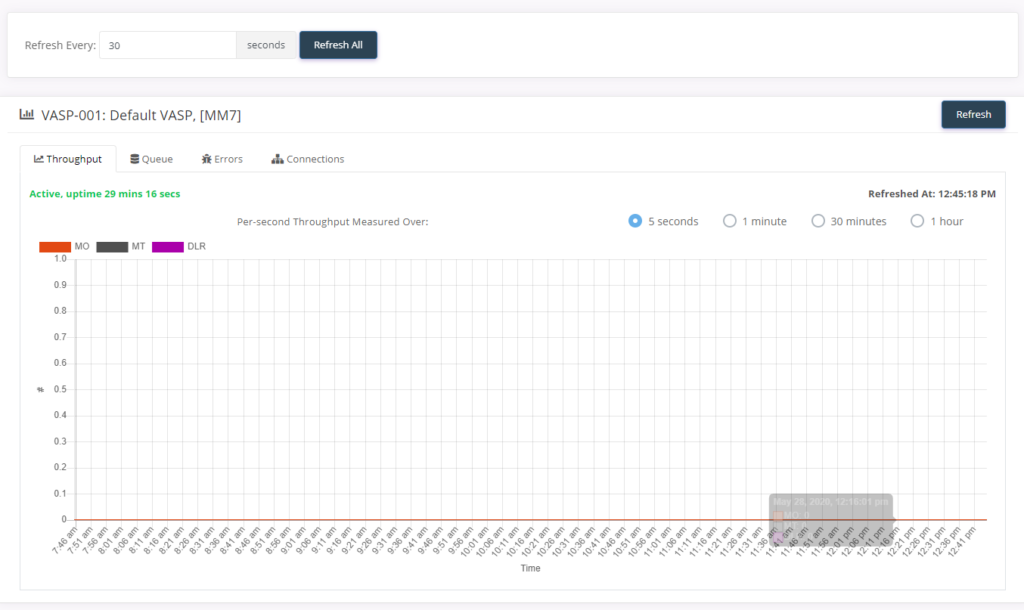
- Throughput: Shows the transactions per second (MO, MT, DLR, and in the case of MM1 binds, notifications) measured over 5 seconds, 1 minute, 30 minutes, or 1-hour intervals.
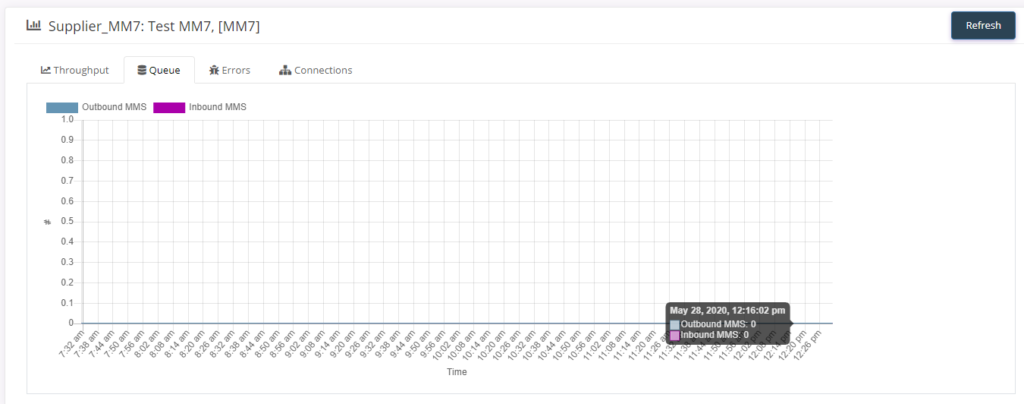
- Queue: The bind queue stats: inbound and outbound messages in the queue.
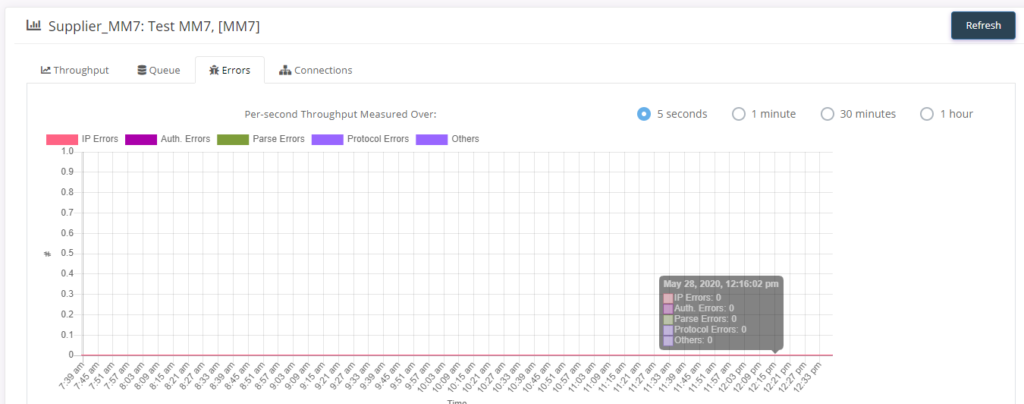
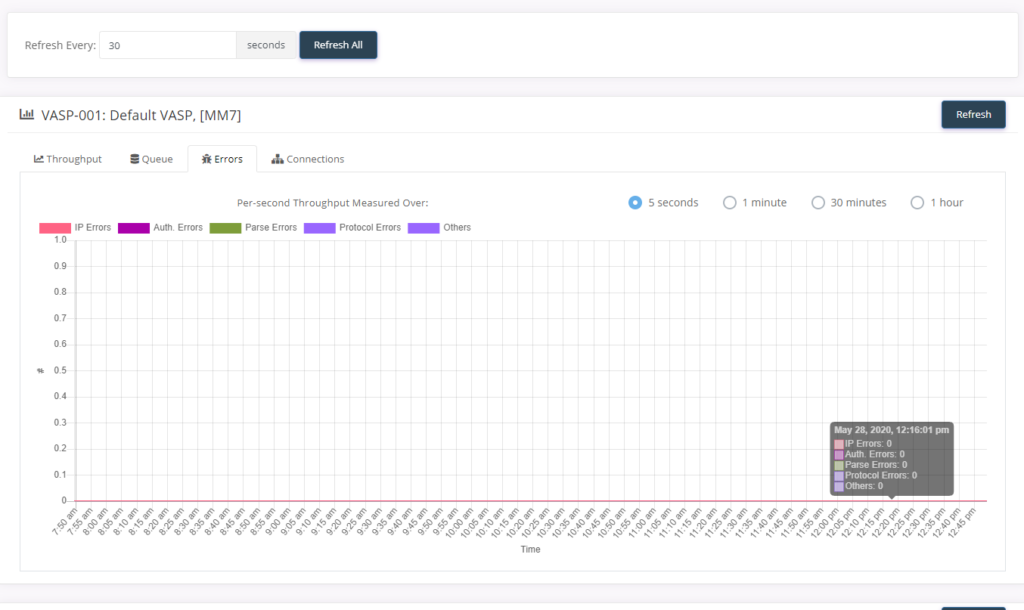
- Errors: The authentication errors, protocol errors, IP errors (i.e. attempted access from a non-whitelisted IP for the bind), parse errors (i.e. invalid packet format), and other errors on the bind interface.
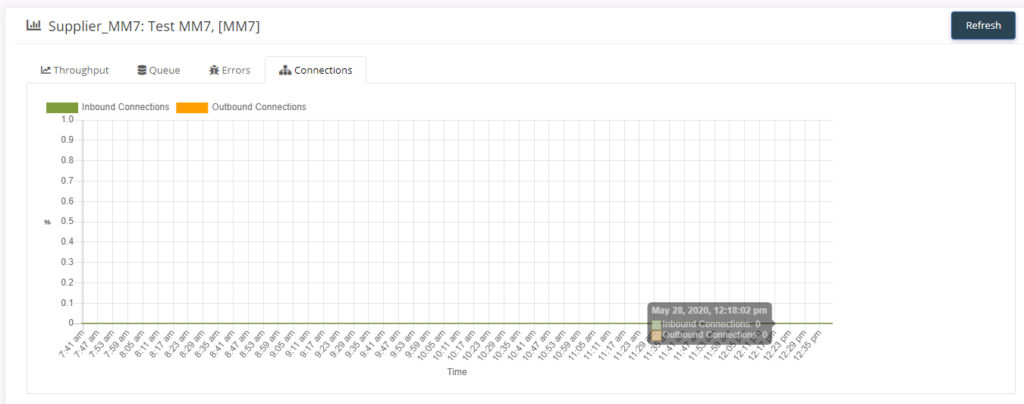
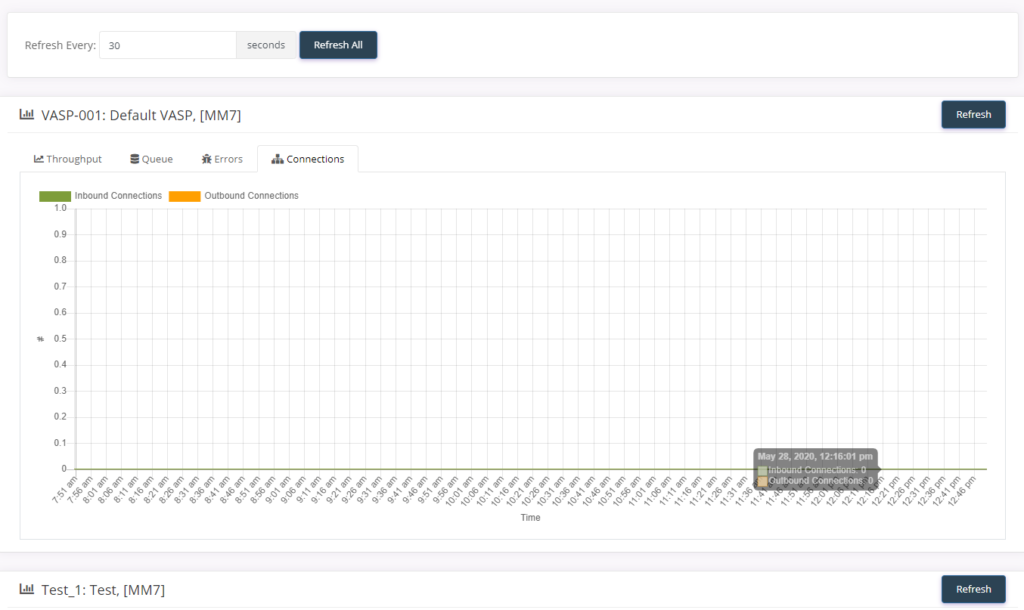
- Connections: Inbound and outbound network connections on the bind.
Each of the graphs displays the live statistics for up to the last five hours. The view will refresh periodically (by default every minute), or if you click the Refresh or Refresh All buttons.
Suppliers #
Queue

Errors
Connections
Clients #
Queue
Errors
Connections
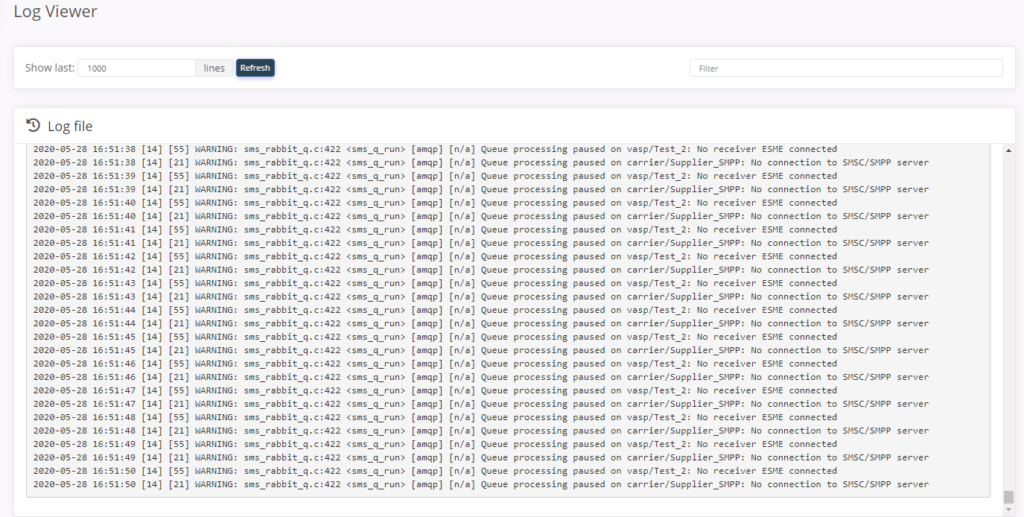
Logs #
Lark Router writes system messages to a log file lark.log in the log files directory (see Core configurations). You are able to access logs to quickly view errors or general log messages. By default the log viewer shows the last 1000 lines of the log file, however, you can change this. You can also use the filter option to search for lines containing a particular keyword. For instance, to see SMPP-related traffic, you can filter by the “SMPP” keyword.